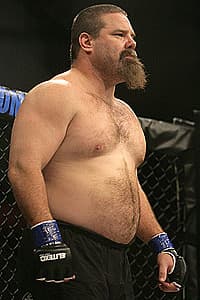
Per-15-minute breakdown — where this fighter lands, and where they get hit.
UFC only
DA
David Abbott
Landed per 15
Head
26.0
no division reference
Body
1.4
no division reference
Leg
0.0
no division reference
Absorbed per 15
Head
20.0
no division reference
Body
10.0
no division reference
Leg
6.7
no division reference
Career totals — landed / attempted
Landed (career total)
Zone
Per 15
Landed
Attempted
Accuracy
Head
26.0
148
342
43%
Body
1.4
8
9
89%
Leg
0.0
0
0
—
Absorbed (career total)
Zone
Per 15
Landed
Attempted
Accuracy
Head
20.0
114
207
55%
Body
10.0
57
61
93%
Leg
6.7
38
40
95%
Per-15-minute rates and totals come from UFCStats fight-totals across this fighter’s UFC career. Percentile context is computed against every fighter currently assigned to this weight class with at least two recorded UFC bouts. “Absorbed” percentiles are inverted so “top of division” always means better outcome.
Derived metrics
Computed from UFC career stats
Strike differential
SLpM − SApM
-2.2
Defensive rating
(str def + td def) / 2
52%
Striking edge
str acc − (100 − str def)
-32%
Career grappling
UFC career
Takedowns / 15min
1.07
Takedown accuracy
33.00%
Sub. attempts / 15min
0.00
Takedown defense
66.00%
Grappling
Per-15-minute breakdown of wrestling output and ground control.
UFC only
DA
David Abbott
Offense
Takedowns
per 15 min
1.8
no division reference
TD accuracy
% of attempts landed
63%
no division reference
Sub attempts
per 15 min
0.7
no division reference
Control
min on top, per 15
0.4 min
no division reference
Defense
TD defense
% of opponent attempts stopped
71%
no division reference
Controlled
min on bottom, per 15
0.3 min
no division reference
Career totals — landed / attempted, control time
Offense
Takedowns
10 / 16
Submission attempts
4
Control time
2:03
Defense
TDs defended
10 / 14
Control absorbed
1:59
Rates above are per 15 minutes of UFC fight time (85min total). Value colors reflect the per-15 rate’s percentile against the current weight class baseline; raw totals without a division reference stay neutral.
Pace & fade
How this fighter's work rate holds up as a fight wears on — round-by-round output (striking, takedown attempts, and control time combined), and whether they fade. The fade % compares round-3 output to round 1 over bouts that reached the third round.
UFC only
DA
David Abbott
18 UFC bouts (per‑round) · 85 min
—
< 2 bouts to R3
Abbott hasn't reached the third round in enough UFC bouts to read a reliable fade pattern — most of their fights end early. The round-by-round pace below is shown for what rounds there are.
DA
AbbottOutput / min
Rounds backed by fewer than 2 bouts are drawn smaller and dimmed with an n= count — a deep round seen in one or two fights is a thin sample, not a settled rate. Per-round bout counts are in the breakdown below.
Full per-round breakdown
What drives the pace · per round
The composite output line above blends these three inputs — splitting them out shows whether the work rate is built on striking volume, takedown pressure, or top control, and which input fades.
Sig. strikes landed
DA
Abbottlanded / min
Takedown attempts
DA
Abbottattempts / min
Control time
DA
Abbott% of round
Round
Output / min
Sig landed / min
Sig absorbed / min
TD att / min
Control
Bouts
R1
2.5
1.9
2.4
0.18
3%
18
R2
2.3
1.3
2.5
0.33
0%
2
Output / minis the headline work rate — significant strikes landed, plus 3 per takedown attempt, plus one per 15 seconds of control — so a takedown-and-grind round isn’t scored as idle the way bare striking volume would. The remaining columns are its components. Per-round rates use UFCStats per-round data (available for ~95% of bouts since 2008). Each round’s rates are averaged only over bouts that reached that round, so the bout count shrinks as rounds deepen. The final round of a finished fight is pro-rated by its actual length.
Schedule Score
Who they've faced × what they've done. Percentile-ranked across every UFC fighter w/ ≥3 resolved bouts. Recent fights weighted heavier.
UFC only
DA
David Abbott
18 resolved UFC bouts
Schedule Score
26/ 100
0255075100
Schedule strength
who you've faced (time-weighted)
15
32nd percentile
Quality wins
what you've done against that schedule
41
25th percentile
How to read this
Every UFC opponent is scored by where they were ranked and what their UFC record was at the time of that fight — not where they sit today. Schedule strength is the recency-weighted average of opponent quality; quality wins scores actual results against that schedule (finishes count more than splits, losses cost the full opp quality). The headline is a percentile rank against every UFC fighter with at least three resolved bouts. Note: UFC ranking data is sparse before December 2018, so legacy-era fighters score from opponent UFC record-at-time when ranks are missing.
Opponent quality distribution
Every UFC bout, grouped by who the opponent was at the time.
3
2
12
Title-fight challengerBout was for a title (no other rank signal)
Established5+ UFC wins entering the bout, ≥.500
Building3+ UFC fights, ≥.40 win rate
UnprovenFewer than 3 fights, or sub-.40 win rate
Tier
Bouts
Record
Win rate
Title-fight challenger
3
0-3
0%
Established
1
0-1
0%
Building
2
1-1
50%
Unproven
12
7-5
58%
Highest-quality opponents
Toughest opponents on the scheduleScore, scored at the time of the fight.
Per-bout quality scoring: champion = 100; same-division ranks 1–5 = 90 → 78 linear; ranks 6–15 = 75 → 60 linear; cross-division champion = 78; cross-division ranked = 45; title-fight challenger (no rank signal) = 50, bumped to 65 when opp had an elite career UFC record at the time. Unranked opponents are scored on UFC record-at-time (long-tenured vet 60, contender-level 45, established 30, building 18, unproven 8). P4P top-10 at time adds +5; top-3 adds +8 (capped at 100). The Schedule Score combines schedule strength (65%) and quality wins (35%), then is held toward a rookie baseline for fighters with limited UFC experience so a thin résumé reads honestly low.
Career cohorts
18 resolved UFC bouts
Performance broken down by situation — camp length, response to the previous result, title-fight presence, and rematches. Computed across every completed UFC bout.
Camp length
Days between fights
Short turnaround
< 100 days
6-3
9 bouts
Typical camp
100–180 days
1-5
6 bouts
Long layoff
> 180 days
1-1
2 bouts
UFC debut
first UFC bout
0-1
1 bout
Post-result bounce
Performance based on the previous UFC result
After a loss
next bout after a defeat
4-5
9 bouts
After a win
next bout after a win
4-4
8 bouts
First UFC bout
no precedent
0-1
1 bout
Title fights
Performance with a belt on the line
All title fights
as challenger or champion
0-3
3 bouts
As champion
defending the belt
—
As challenger
fighting for the belt
0-3
3 bouts
Rematches
Performance when meeting an opponent again
All rematches
any second meeting
—
Revenge bouts
lost the first meeting
—
Encore bouts
won the first meeting
—
Method of victory & defeat
8-10 UFC
KO / TKO
5 wins, 3 losses
incl. 1 cut/injury stoppage — not a clean KO
W5
L3
Submission
2 wins, 5 losses
W2
L5
Decision
1 win, 2 losses
W1
L2
Finishes
UFC KOs
5
Knockdowns / fight
0.22
UFC submissions
2
Submission attempts / fight
0.22
KO history
UFC fights only — knockout power, chin durability, and when the last finish landed. Genuine knockouts are kept separate from cut, injury, and corner stoppages.
DA
David Abbott
Knockout rate
28%
5 KO/TKO wins
Knockdowns dealt
4
2.70 per 100 head
Clean KO losses
2
cuts / injury TKOs excluded
Knockdowns absorbed
3
2.63 per 100 head
Activity & layoff
When this fighter last competed, how often they've been active, and how that reads against active peers in their division.